42% of U.S. homes for sale
have cut their price.
Prices are not crashing.
Sellers are catching up to buyers. Price cuts are up seven months in a row, sellers outnumber buyers by the widest gap on record, and the experts still forecast prices rising, just slower.
Six national numbers, and what they mean
National figures only. For Greater Phoenix, see the local edition.
Three charts from the national report
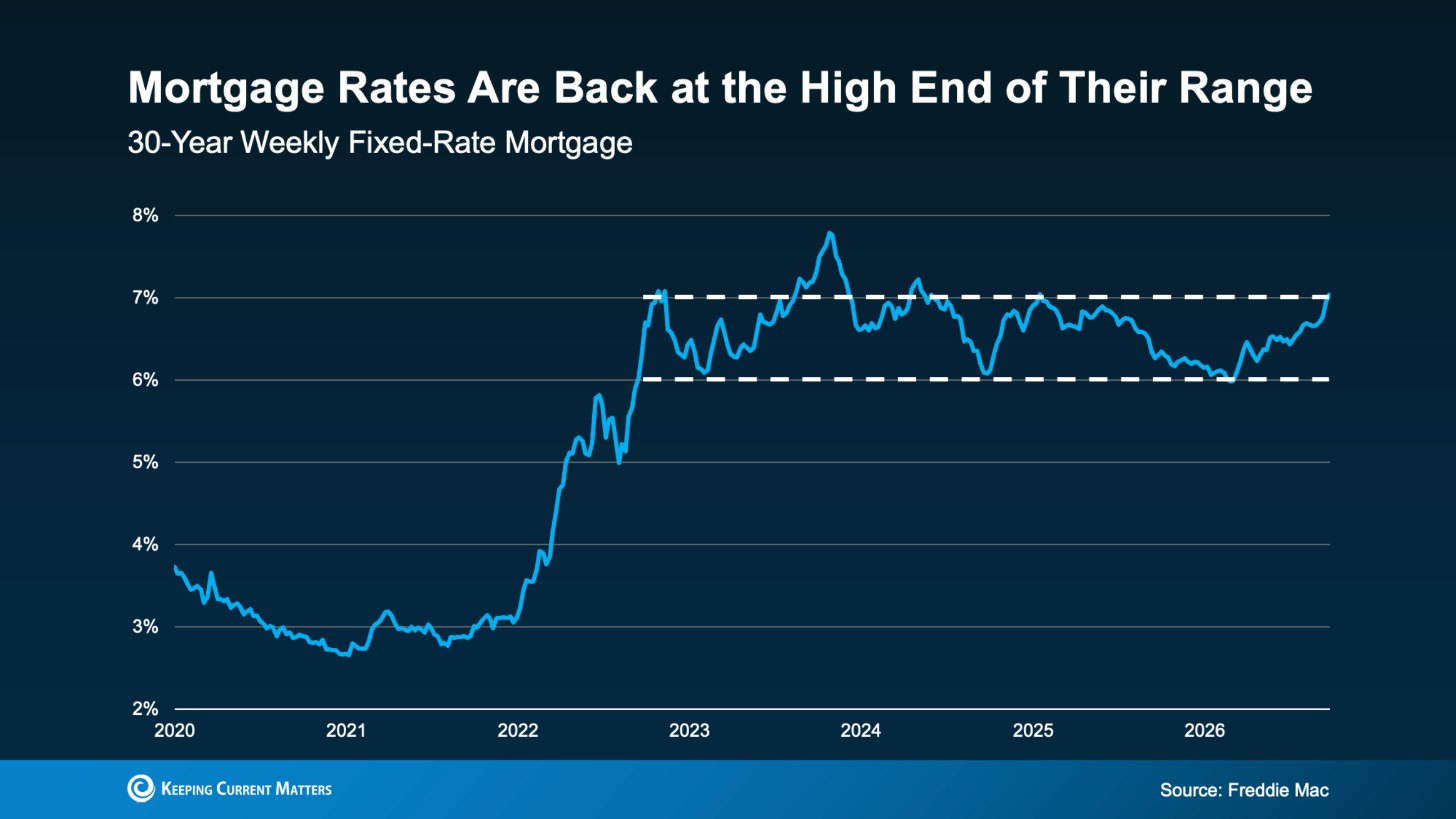
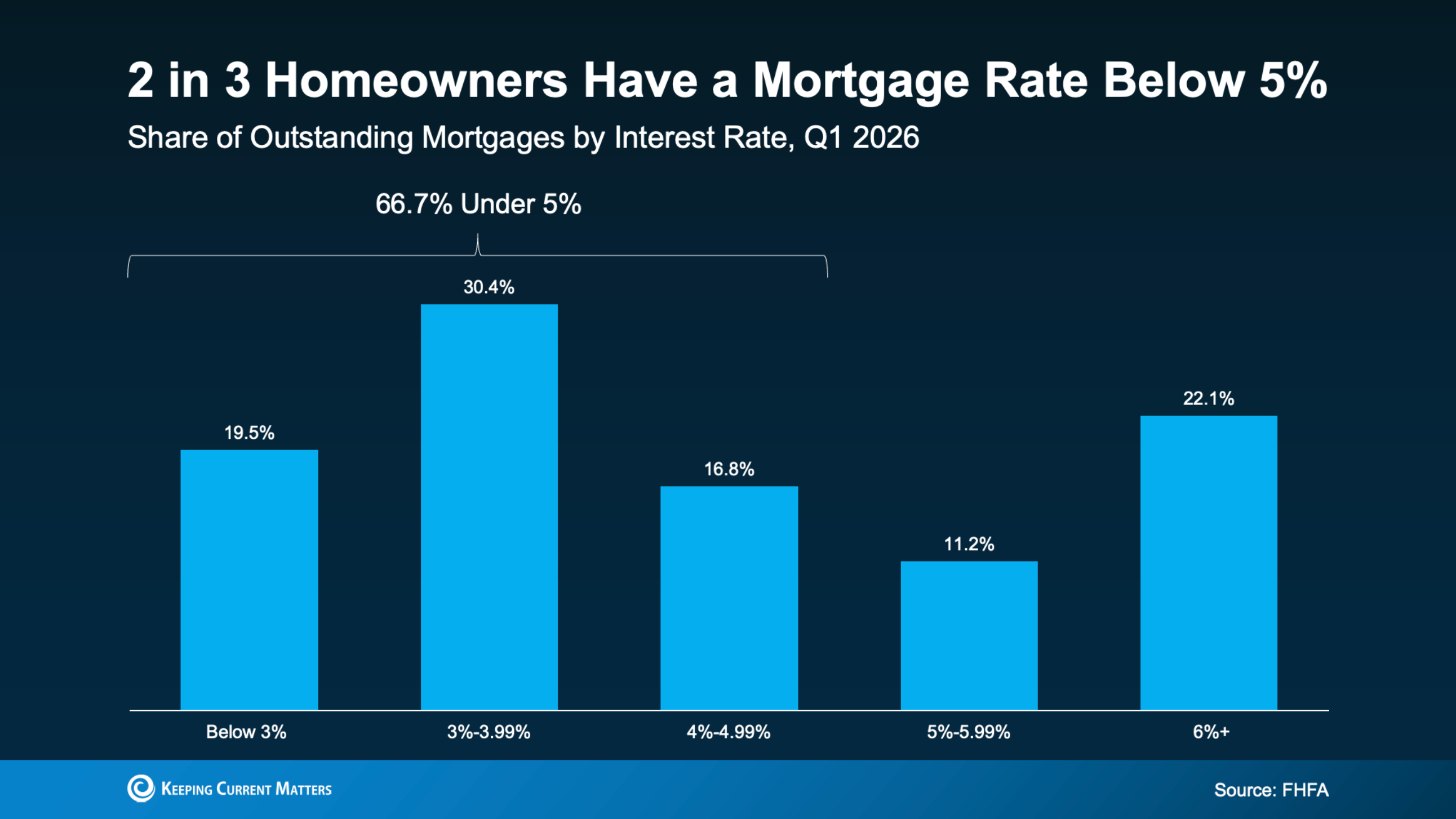
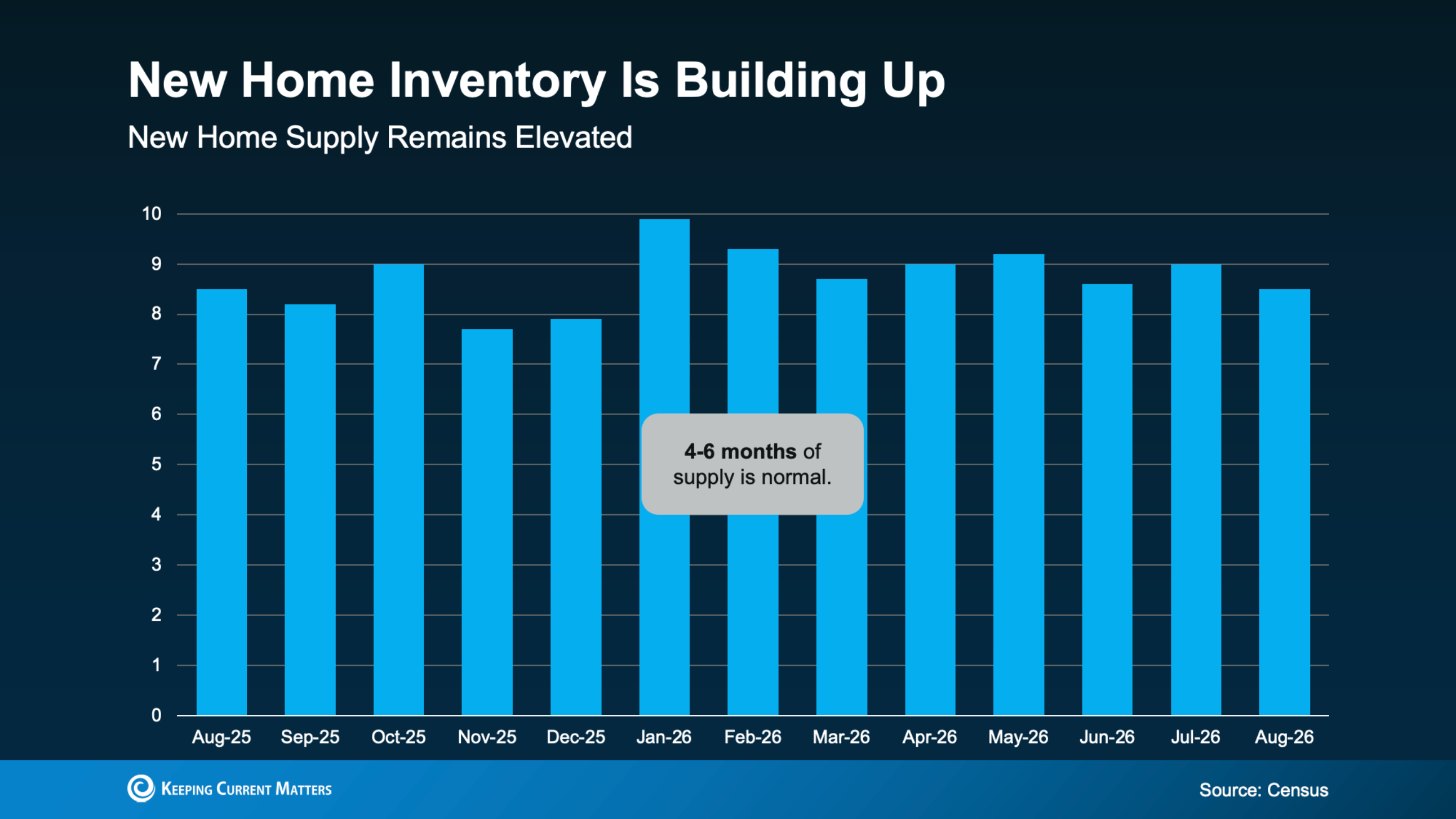
Is this a crash? No.
Fannie Mae's panel of more than 100 housing experts forecasts prices up 2.5% this year and 14.7% over five years. Even the most pessimistic group expects about 6.6% by 2030. A forecast, not a promise.
If you are selling
Price for today's buyer from day one. Your competition includes builders buying down rates, and a seller can offer the same kind of help.
If you are buying
That 42% is your leverage: price, closing costs, repairs. A home that has sat for weeks negotiates differently.
What about your street?
National numbers are the headline. Phoenix does not always move with the country. The local edition comes out mid-month.
The nation is the headline. Your street is the story.
Text me your address and I will send you the numbers for your street, your price band, this month.
Source: Keeping Current Matters, citing HousingWire Data, Redfin, Realtor.com, the Fannie Mae Home Price Expectations Survey and Mortgage News Daily. KCM articles of 24 September, 28 September, 30 September and 1 October 2026. Charts: KCM October 2026 Monthly Market Report, shown as published. National figures only. Published monthly. Forecasts are forecasts. Nothing here is a guarantee of price or timing, and no past edition is edited after publication.
- October 2026 · current edition
- Greater Phoenix: the local edition
Follow my Phoenix market reports on Google. Add DougSellsPHX as a preferred source and my updates show up higher when you search.
+ Add DougSellsPHX on Google